Canada committed $10.75B to naval shipbuilding. The jobs numbers still can't be confirmed.
An independent synthetic-control analysis of the National Shipbuilding Strategy's regional employment and industrial capacity effects — four methods, four treatment dates, no cherry-picking.
1The claim, and why it can't be checked the way it was made
Canada's National Shipbuilding Strategy (NSS) originally was launched in 2010. The policy was designed to solve an ongoing problem in the Canadian fleet. For decades naval procurement followed a boom-bust cycle, where ships would be commissioned, and left to atrophy over the next 20 years. Instead of ongoing modernization, capacity would have to be rebuilt at high costs over a short period of time. NSS committed decades-long builds in select shipyards on both coasts. The shipyards that were selected were the Irving shipyard in Halifax for combat vessels and Seaspan in Vancouver for non-combat capacity. Later Chantier Davie in Quebec was also included in the policy. Beyond shipbuilding, this policy was also designed to create a permanent skilled industrial workforce, and stable domestic industrial supply chain, by smoothing spending, enabling workers previously exposed to the variance of contract awards to plan more stable careers.
The Conference Board of Canada estimates the NSS supports an average of ~10,600 jobs a year nationally, with a cumulative $11.3B of labour income between 2013 and 2027. This target was arrived at through Input-output modelling. This approach uses Statistics Canada input-output tables, which use an economy-wide matrix to model overlapping supply chains throughout Canada, basically showing how much every industry buys from every other industry to produce a dollar of output. In the Shipbuilding case, in the first layer firms supply steel, engineering services, electronics, logistics, in the second layer steel firms buy from mines and electricity. As you can imagine this creates a complicated network. If for example $8B goes into naval shipbuilding, and propagates through the matrix there are direct effects on shipyard wages, indirect supplier wage effects, and induced effects, for example when workers spend paycheques at restaurants. Summing these effects, and then dividing by average wage and the IO model would output 8200 jobs. However it is still important to note that by the Conference Board's own numbers, only 4,500 of the claimed 10,600 jobs are located in Nova Scotia at all, which is well under half. NSS's own economic-impact studies describe a nationally dispersed supply chain, so we should not expect overly concentrated results in Halifax.
A note on these numbers — they move across editions
A 2023 edition of the same report series cited $6.2 billion in labour income (2013–2024) and 8,200 jobs annually (2016–2024) — the illustrative $8B example above traces back to that edition. A 2024 edition cited roughly $17 billion in GDP and ~9,300 jobs annually (2016–2025), with 4,200 in Nova Scotia. All editions describe impacts attributable specifically to Irving Shipbuilding's Halifax Shipyard operations and supply chain — not the National Shipbuilding Strategy as a whole. Seaspan's Vancouver Shipyards and Chantier Davie's Lévis operations are not included in any of these figures.
Sources: Conference Board of Canada, Irving Shipbuilding's summary page.
There are three reasons to re-evaluate the estimates produced by an IO model. Firstly the coefficients that quantify how spending in one sector translates to another are set by time-invariant, linear coefficients. So the model does not factor in marginal effects, changing sensitivity, or how exogenous shocks may affect labour market outcomes. Secondly there is not a counterfactual analysis presented. So we do not know what outcomes would be without the policy. It is difficult to say the Halifax economy grew as a result of the policy without measuring how the economy would have grown anyway. Lastly there is assumed zero alternative use. This assumes that every project input would be idle absent the project. There is no crowding-out, so if a welder left a Halifax construction firm for the shipyard, IO counts a new job, while net regional employment change may be zero. These are all properties of the model used, not flaws of the authors, but the model chosen is nearly guaranteed to create a positive result.
2The method
To overcome the drawbacks of the IO method, I instead use a synthetic control difference in differences approach. The control is synthetic because it builds a counterfactual estimate of what Halifax would look like without the NSS policy. Data from cities that should be completely unaffected by the NSS policy are selected and weighted to resemble the data from Halifax's pre-NSS path closely. Then we measure how our counterfactual no-NSS Halifax diverges from the real NSS Halifax. The divergence is our estimate of policy effect. To add further robustness I used 4 methods to generate the counterfactual Halifax (synthetic DiD, augmented/ridge SCM, classic Abadie SCM, national ITS) at 4 separate candidate dates (2010/2011/2012/2015), and present all findings without cherry picking the best ones.
3Look at the raw data first
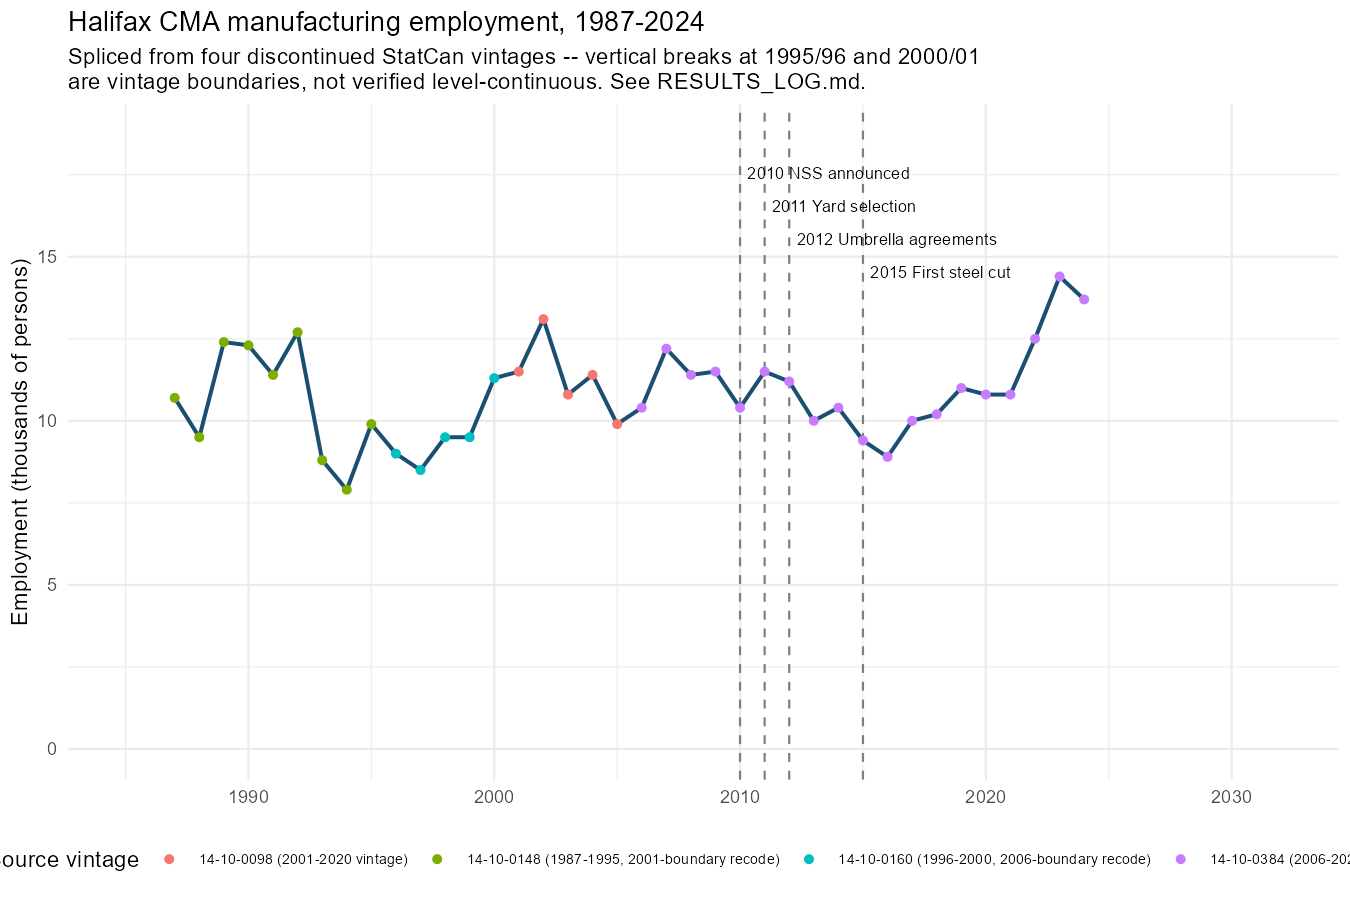
The place to start is the raw data, before any model or method choice. Halifax's manufacturing employment from 1987–2024 doesn't exist in any single Statistics Canada table — the series had to be reconstructed by splicing four discontinued table vintages, StatCan having redefined CMA boundaries and industry classifications several times over that period without ever republishing a continuous series. Once assembled, it shows no visible break at any of the four candidate NSS dates. If anything, employment falls after the October 2011 yard selection. The real increase doesn't start until roughly 2017–2021, peaking in 2023 — six to ten years after every official NSS milestone.
4Can Halifax even be matched?
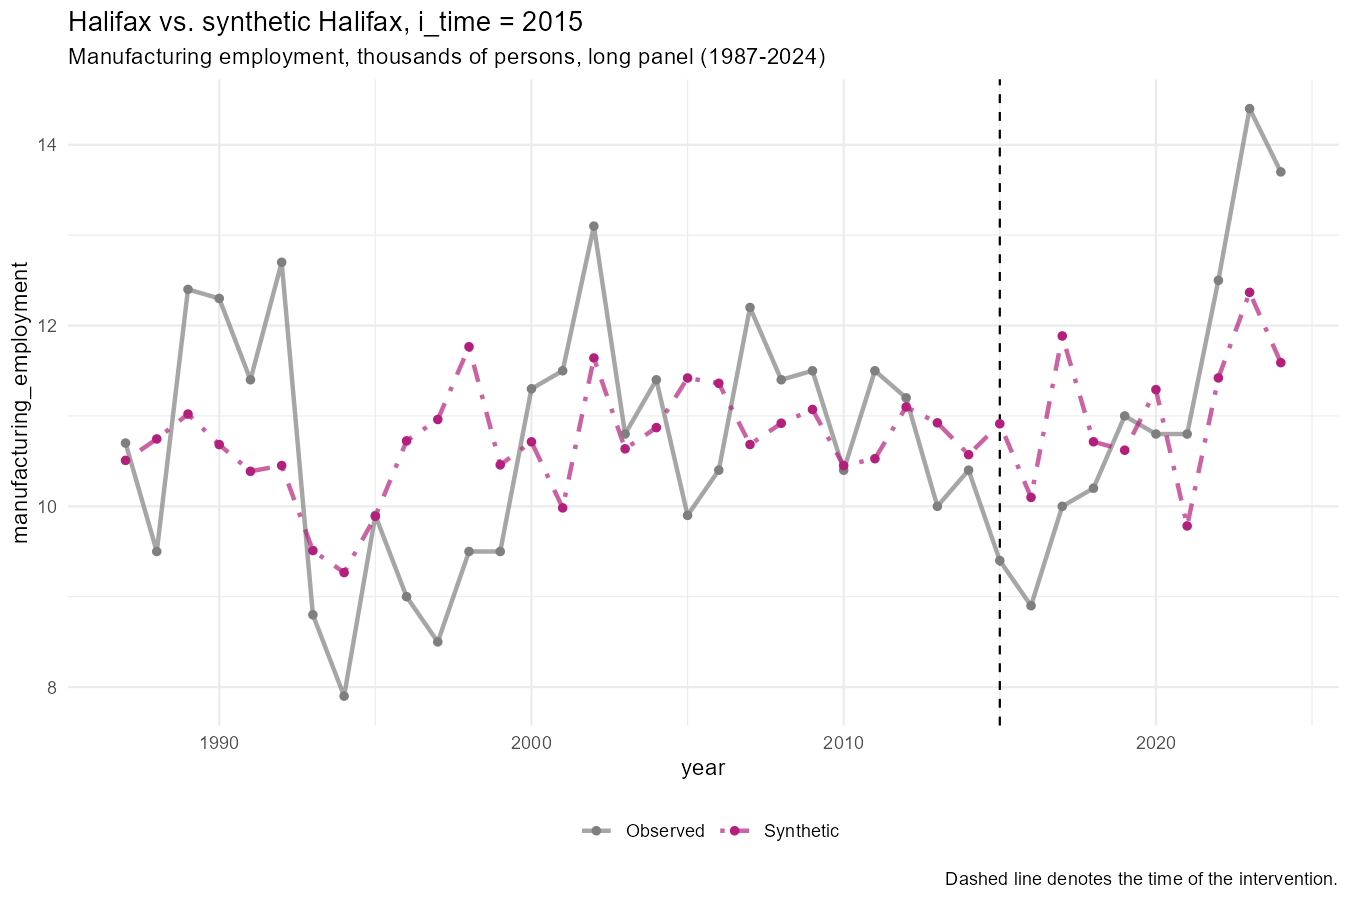
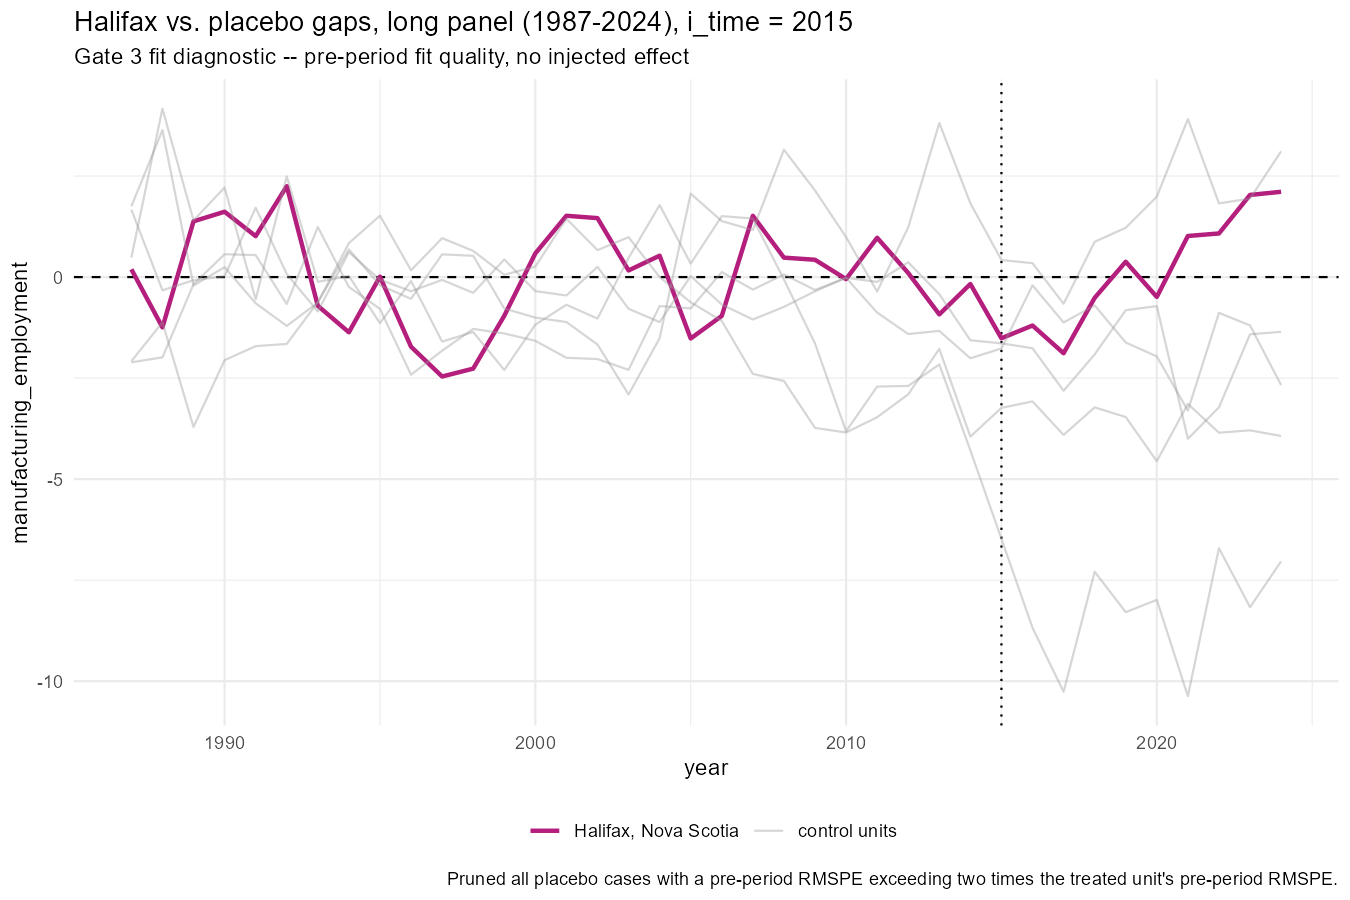
Before trusting any synthetic-control estimate, the counterfactual has to accurately track Halifax's real pre-treatment path. The primary donor pool comprises 16 cities, selected under exclusion rules including oil-price exposure, defence-industrial presence, treatment elsewhere in NSS, which are fixed before any estimate was run. Fit to Halifax's real pre-treatment data, the resulting synthetic control is the 2nd- or 3rd-best-fitting unit of 17 in the entire panel, with donors included, under both a 1987–2024 and a 1996–2024 panel specification. Halifax turns out to be one of the easiest cities in the panel to build a convincing counterfactual for.
How the donor pool was built
35 candidate Canadian CMAs, narrowed to 25 by excluding: Vancouver and Québec (treated elsewhere in NSS), Victoria (Seaspan Victoria Shipyards + CFB Esquimalt — independently confirmed as the #2 dollar recipient in federal contract data), St. John's/Calgary/Edmonton (oil-price exposure — the 2014 collapse falls inside the treatment window), and Montréal/Ottawa-Gatineau/Kingston (significant defence-industrial presence unrelated to NSS specifically). The primary panel further restricts to the 16 of those 25 with complete data coverage back to 1987. Every exclusion was decided and documented before any estimate was run.
5Running it four ways
Four methods, run at the better-powered of the two headline dates (2015 — see the national-picture section below for why).
| Method | Estimate | Significant? |
|---|---|---|
| Synthetic difference-in-differences | −300 employees | No — 95% CI [−6,800, 6,200] |
| Augmented SCM (ridge) | ~3,200 employees (2023) | Close — best p = 0.10, the boundary |
| Classic SCM (Abadie) | 1.18× post/pre fit ratio | No — p = 0.59 |
| National ITS | +175% national shipments | Yes — p ≈ 2×10⁻³³, but no regional counterfactual |
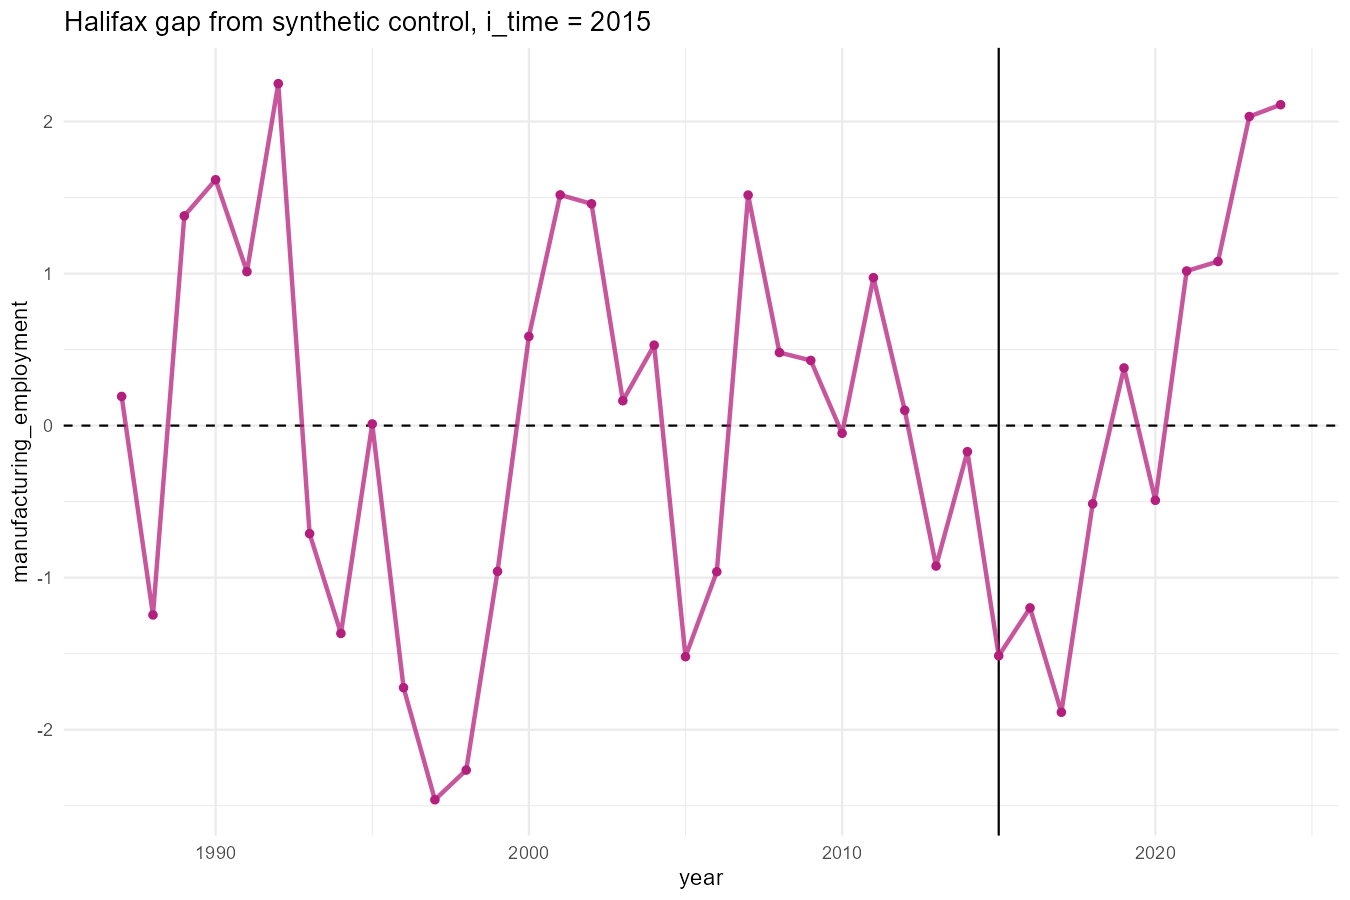
Running the comparison between post NSS Halifax and our counterfactual Halifax with the Synthetic Difference in Differences (Synthdid) method, we find the post NSS Halifax is −300 employees below the counterfactual, which is inside of our 95% confidence interval: [−6,800, 6,200], so is a null result. Finding the policy had no observable effect.
Running the same comparison with the counterfactual generated using the Augmented SCM (ridge), we find a ~3,200 increase in employees in 2023, which is our most significant result with p = 0.10, which is a boundary result, not cleanly past it. Indicating potentially a small effect, not guaranteeing it.
The classic Abadie synthetic control, with nameable donor weights, places Halifax's post-treatment path at 1.18 times its pre-treatment fit error, with a permutation p-value of 0.59, which does not indicate any significant effect. This result, however, does hinge almost entirely on one donor city (see the Regina section below).
The national interrupted time series is the outlier, indicating national shipbuilding shipments rose 175% after 2015 relative to trend, with a p-value near 2×10⁻³³ strongly indicating significant results. But this method has no regional counterfactual at all. It can say something changed nationally in the shipbuilding industry, not that it changed in Halifax specifically, or that NSS caused it rather than some other industry-wide shift.
6The Regina problem
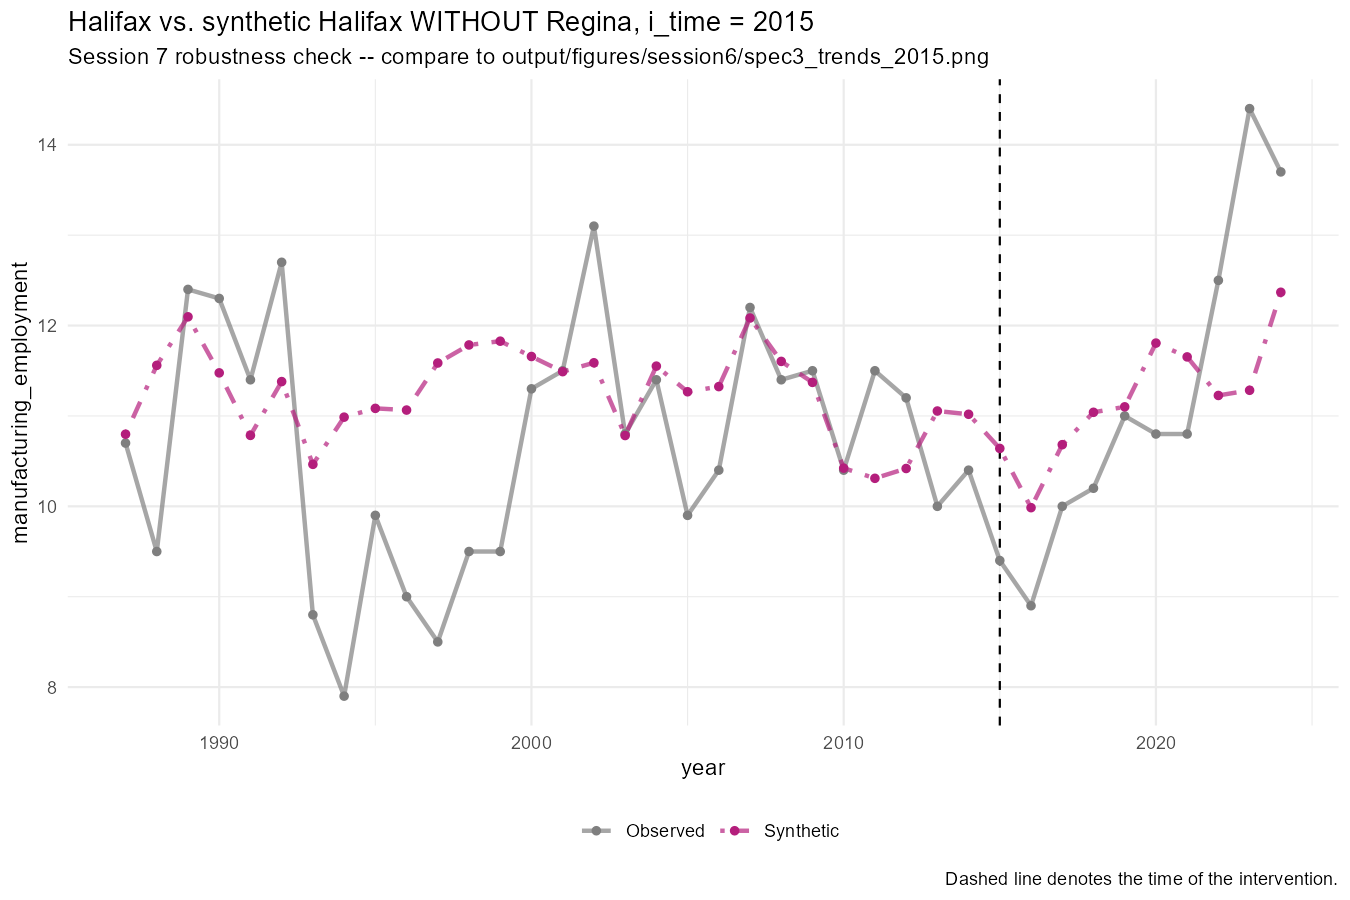
A notable limitation with one of the methods used is that the classic SCM's synthetic Halifax places nearly all of the model's weight (98.8%) on Regina, Saskatchewan, not a more evenly distributed blend that the model should generally produce. Dropping Regina, the post/pre fit ratio drops from 1.18 to 0.998, resulting in the divergence from the observed Halifax to essentially vanish. Furthermore, after performing a full sweep of the other 16 donors, where one donor is deliberately excluded to test if removing a single donor moves the result, only Regina does.
7The Vancouver surprise
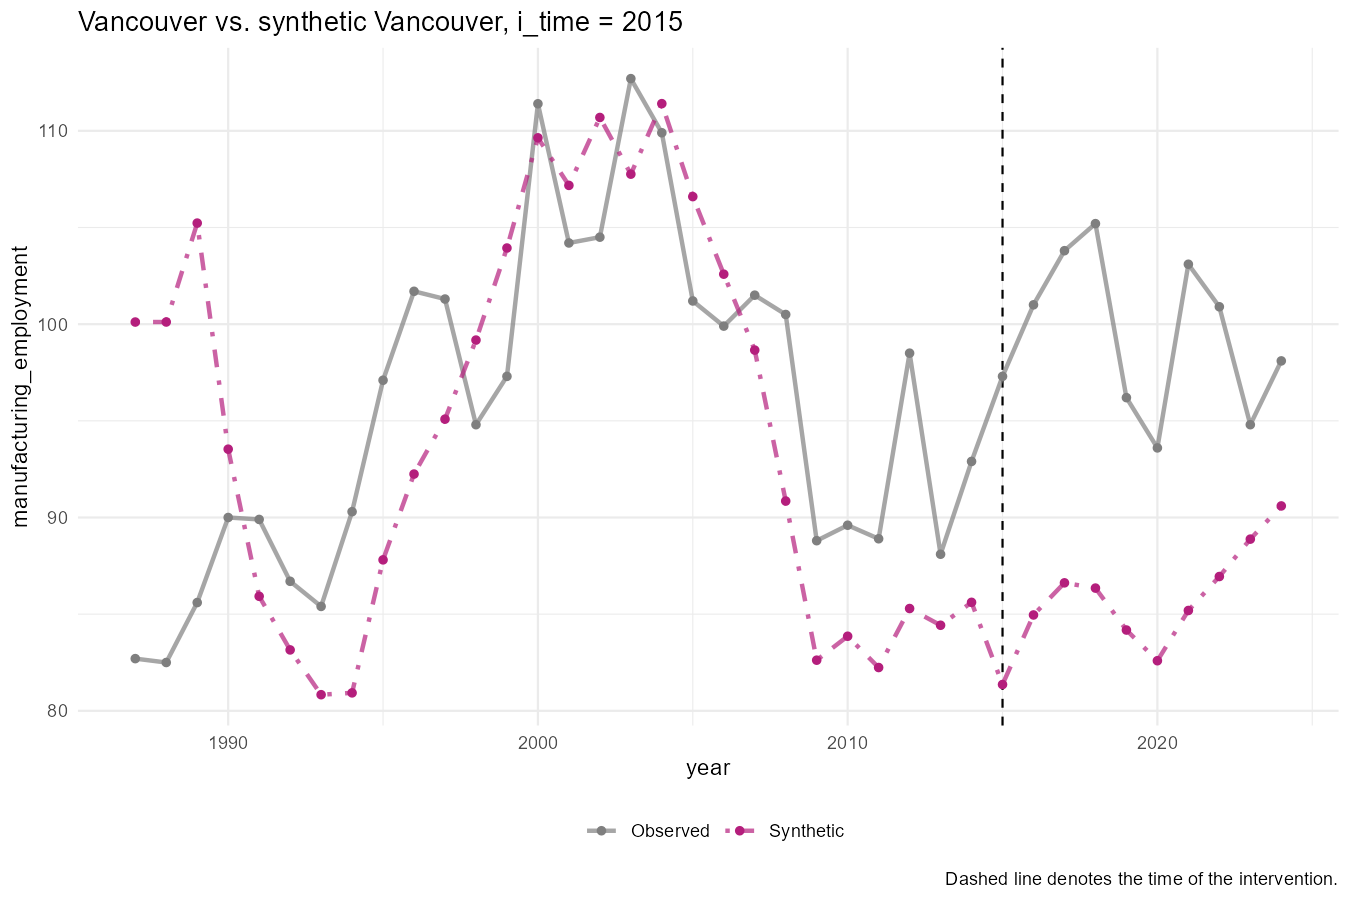
Performing the same tests on Vancouver, with the same 4 dates and identical donor-construction rules, we find fit ratios 2.5–2.9× at every date (vs. Halifax's 0.9–1.2×), which is roughly double to triple, entailing larger post-treatment divergence. Additionally, the Synthetic Vancouver is a genuine 3-city blend (Kitchener 57%, Winnipeg 31%, Toronto 12%), so avoids Regina-style fragility, where the synthetic is concentrated on one city.
| Treatment date | Halifax | Vancouver |
|---|---|---|
| 2010 | 0.87 | 2.92 |
| 2011 | 0.91 | 2.81 |
| 2012 | 1.02 | 2.57 |
| 2015 | 1.18 | 2.55 |
Post/pre synthetic-control fit ratio — higher means a larger post-treatment divergence from the counterfactual, not a "better fit"; pre-treatment fit quality is a separate, already-passed check for both cities.
The Vancouver model still does not identify significant effects of the NSS policy, with the best p value being p = 0.29, and a 17-unit floor of 0.059. The takeaway is that, while still not significant, evidence points more toward an effect in Vancouver than in the city where you'd expect to see a greater effect. It's worth being explicit about what the balance of evidence actually says: public attention, the Conference Board's own reports, and this project's original design all centre on Halifax as the case study, because Irving holds the larger award and Halifax's shipbuilding-to-economy ratio was assumed to be the more favourable one for detecting an effect. The data doesn't obviously support that assumption.
8The national picture
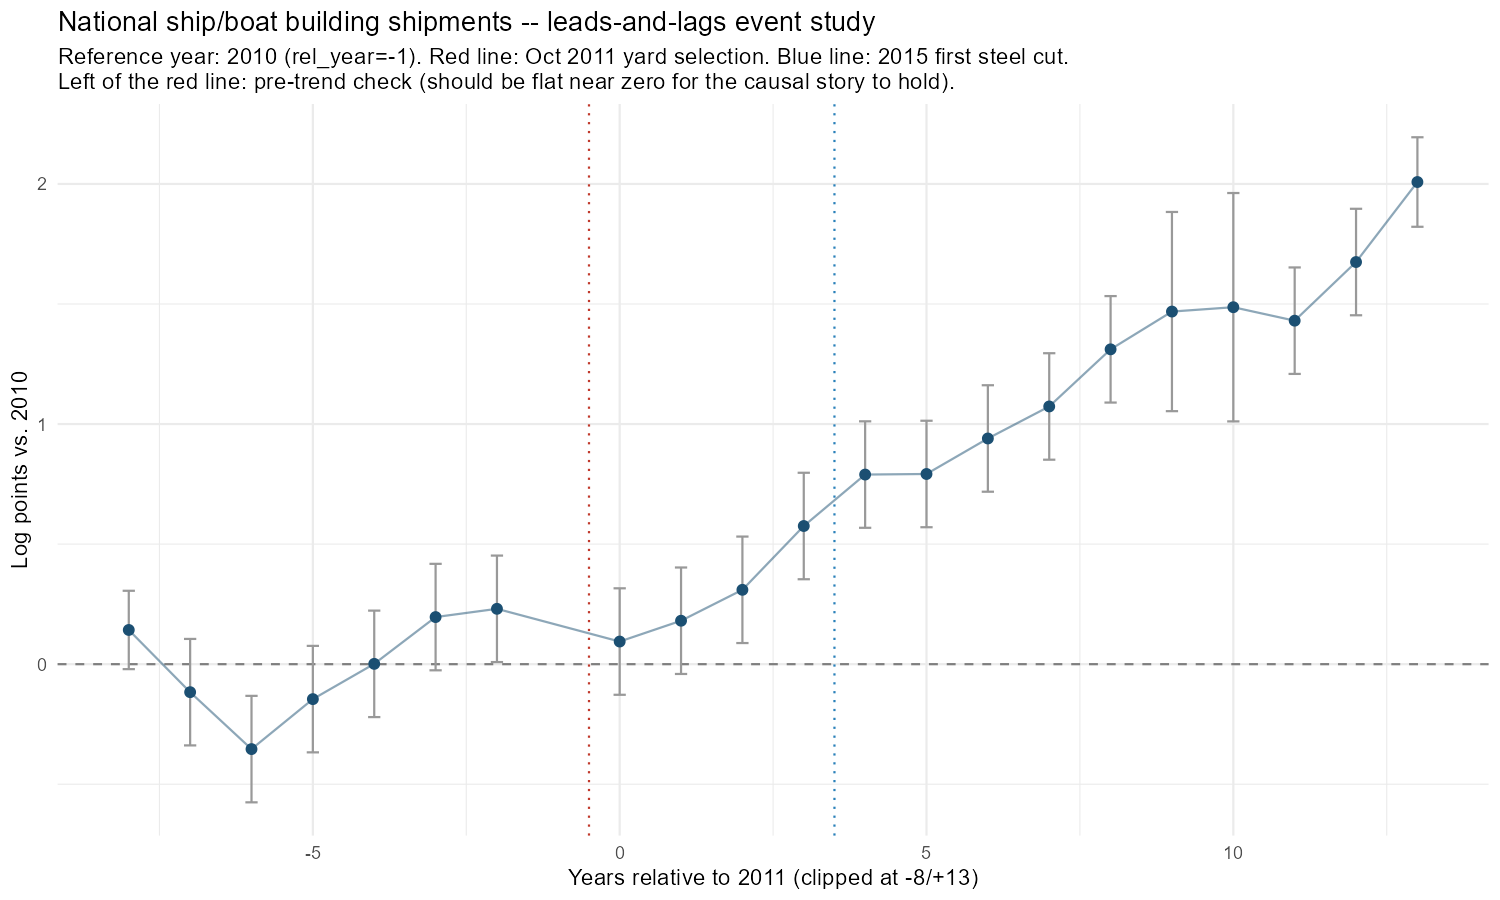
Stepping back to look at the national rather than regional level and examining the physical output of the whole Canadian shipbuilding industry (StatCan table 16-10-0047-01), I find shipments up 27% on national ship and boat building following the October 2011 yard selection. This is arrived at through a leads-and-lags study, and is significant with a p-value of 0.003. Further, I find a 175% increase following the 2015 first-steel milestone (p ≈ 2×10⁻³³). Critically, growth is sustained at roughly 7.4 times the 2010 level by 2024, with no sign of leveling off.
The honest caveat on this result
This should be caveated by the fact that the pre-2011 period isn't perfectly flat. Two of the seven pre-treatment years show individually significant deviations from the baseline. However, they don't trend toward the 2011 break. The two significant years point in opposite directions, several years apart, with no deviation in the years immediately before treatment, so should be interpreted as ordinary cyclicality in a small, lumpy industry rather than anticipation of the policy.
9What about actual capacity, not jobs?
Everything above measures employment. But NSS's own stated goal — and the original framing of this question — was industrial capacity: durable yard capability, not just headcount. Employment is a reasonable proxy for economic activity, but it isn't the same thing as physical capacity investment, and a policy could plausibly build the latter (new construction, tooling, equipment) without the former showing up as a large, statistically detectable local jobs number, or vice versa.
The direct capacity indicator — industrial building permit value by city (StatCan table 34-10-0292-01) — initially looked inaccessible: pulling the full table crashed the analysis (a 66-geography by 89-building-type by 22-work-type cube that overwhelmed available memory). Revisited by pulling only the specific data series needed rather than the entire table, it became workable.
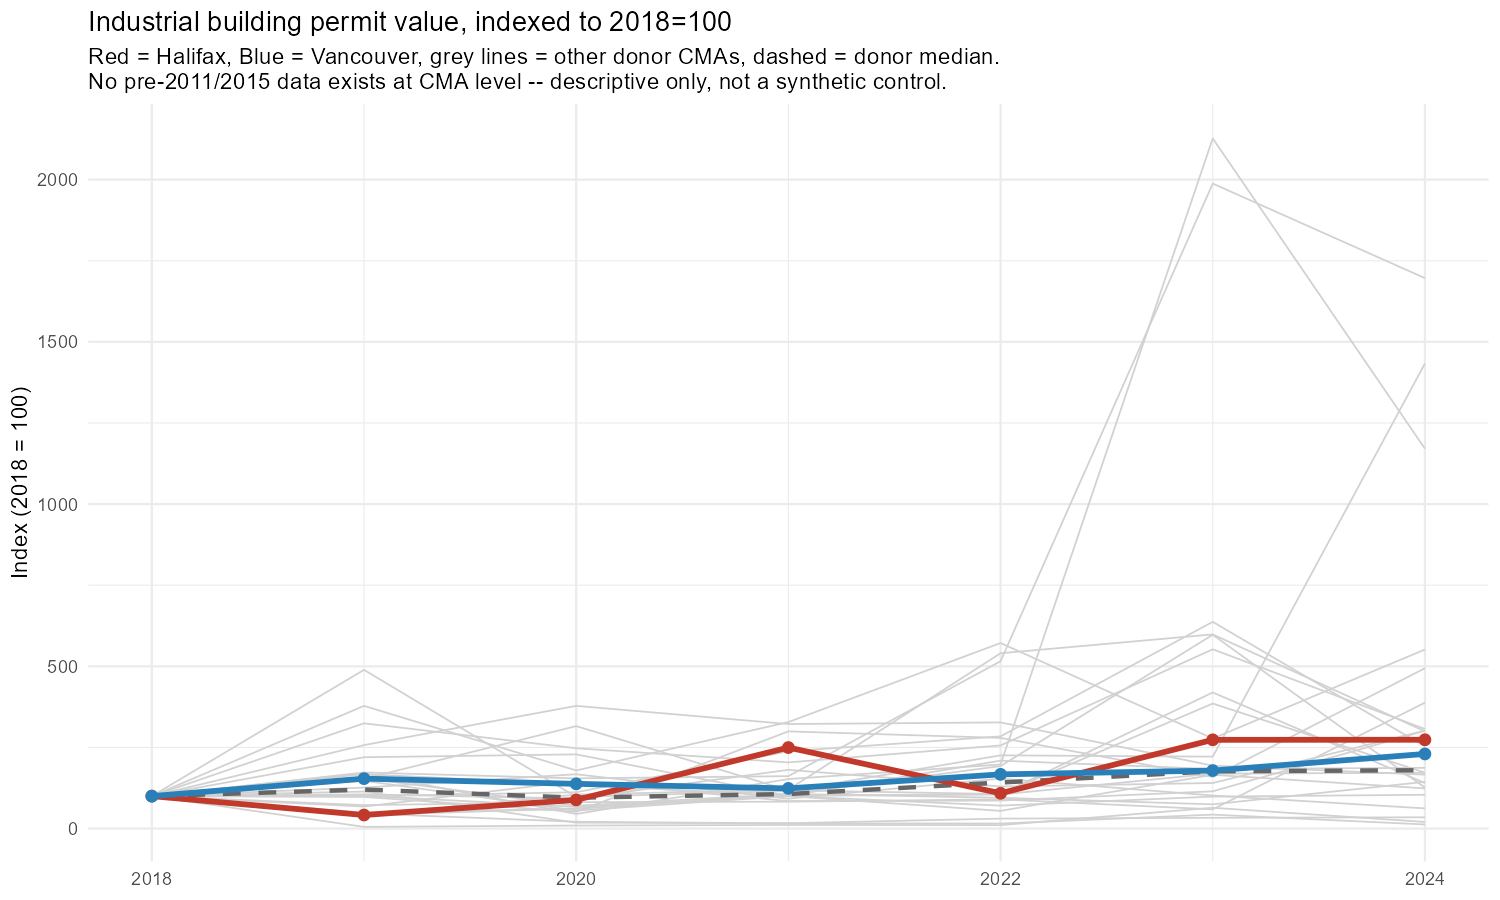
Further adding to the assessment of broader industrial capacity building beyond employment outcomes, like capex and building permits, I find that, once fixed, Halifax ranks 11th of 26 census metropolitan areas (CMAs) — the same donor-pool cities used throughout this analysis — in industrial building permit growth since 2018 (62nd percentile), and Vancouver ranks 13th (54th percentile). Both barely above median. However this may be attributed to a baseline permitting sustaining the new policy. Our data for industrial permit growth only starts in 2018, but the plausible window for major yard-modernization capital spending (new construction, tooling) is 2011–2017. So it is plausible that buildout is not visible because the buildout was mostly finished before 2018, and what we're measuring from 2018 onward is just ordinary maintenance-level permitting on top of an already-completed expansion.
Conversely, cities with zero NSS connection like Windsor at 17×, London at 14×, Trois-Rivières at 12× their 2018 baselines show far bigger swings. However it is important to note that this series only starts 2018, as no CMA-level data further back exists, and is extremely lumpy, with single large projects dominating a city's annual total.
10The verdict
In conclusion, we do not find clean confirmation of NSS, indicating it was largely ineffective, but this should be caveated that the null is also not as clean as it could be. I find a directionally consistent but not-significant regional employment signal that is stronger in Vancouver, but relatively fragile to donor choice in Halifax. It should be noted that the pre-treatment fit of our counterfactuals was strong, which means this null is a real finding rather than an artifact of poor matching. Separately, the national industry-level shift itself is real, large, and still growing. Finally, on the actual capacity dimension, there was no standout signal identified at all.
Sources: Conference Board of Canada — Value for Money; Irving Shipbuilding — Canadian Impact; Statistics Canada tables 16-10-0047-01, 14-10-0148/0160/0098/0384, 17-10-0148, 34-10-0292-01; federal proactive-disclosure contracts file, Open Government Portal. Methodology, full session log, and every specification run (including the null ones) available on request.