Using AI to Assess a UFC Betting Strategy
I am a UFC fan. Every event is sponsored by online sports betting giant DraftKings. While I was considering placing a bet, my friend, whom I was watching the fights with, mentioned that he often bets on the underdog in New York because the fighters' fans and coaches all, to some extent, believe in a cliché that NYC is "the city for the underdog." That belief, even if untrue, can be an edge. Skeptical of his claim and curious whether bookmakers had somehow overlooked a New York factor in their equations, I decided to conduct a quick and dirty analysis, relying heavily on ChatGPT to find data, perform most of the coding, and complete some of the modelling. It is possible that there are errors in this project; thorough and robust findings were not the goal. I did not use any complicated models, and mostly identified results by eyeballing graphs (to see a result worth betting on, on my bankroll, the effect had to be big enough to be visible). What I think this project shows is that with ChatGPT, I can rapidly produce insights that contribute to a better understanding of a real-world event.
My first task was to find an existing dataset that I could easily load and work with. The dataset I ended up using was one ChatGPT identified, which included fight results, locations, and odds. To get an initial assessment, I converted the odds into probabilities, giving the bookmakers the probability of the red corner winning or the blue corner winning. Then, using this formula:
(probability of red corner winning + probability of blue corner winning) − 100 = house margin
I calculated the house margin. Values above zero represent the house margin, which has been increasing over time. It is currently right around 5%. This means that with 50/50 odds, if you made equal bets on both sides, you would lose 5% of your bet.
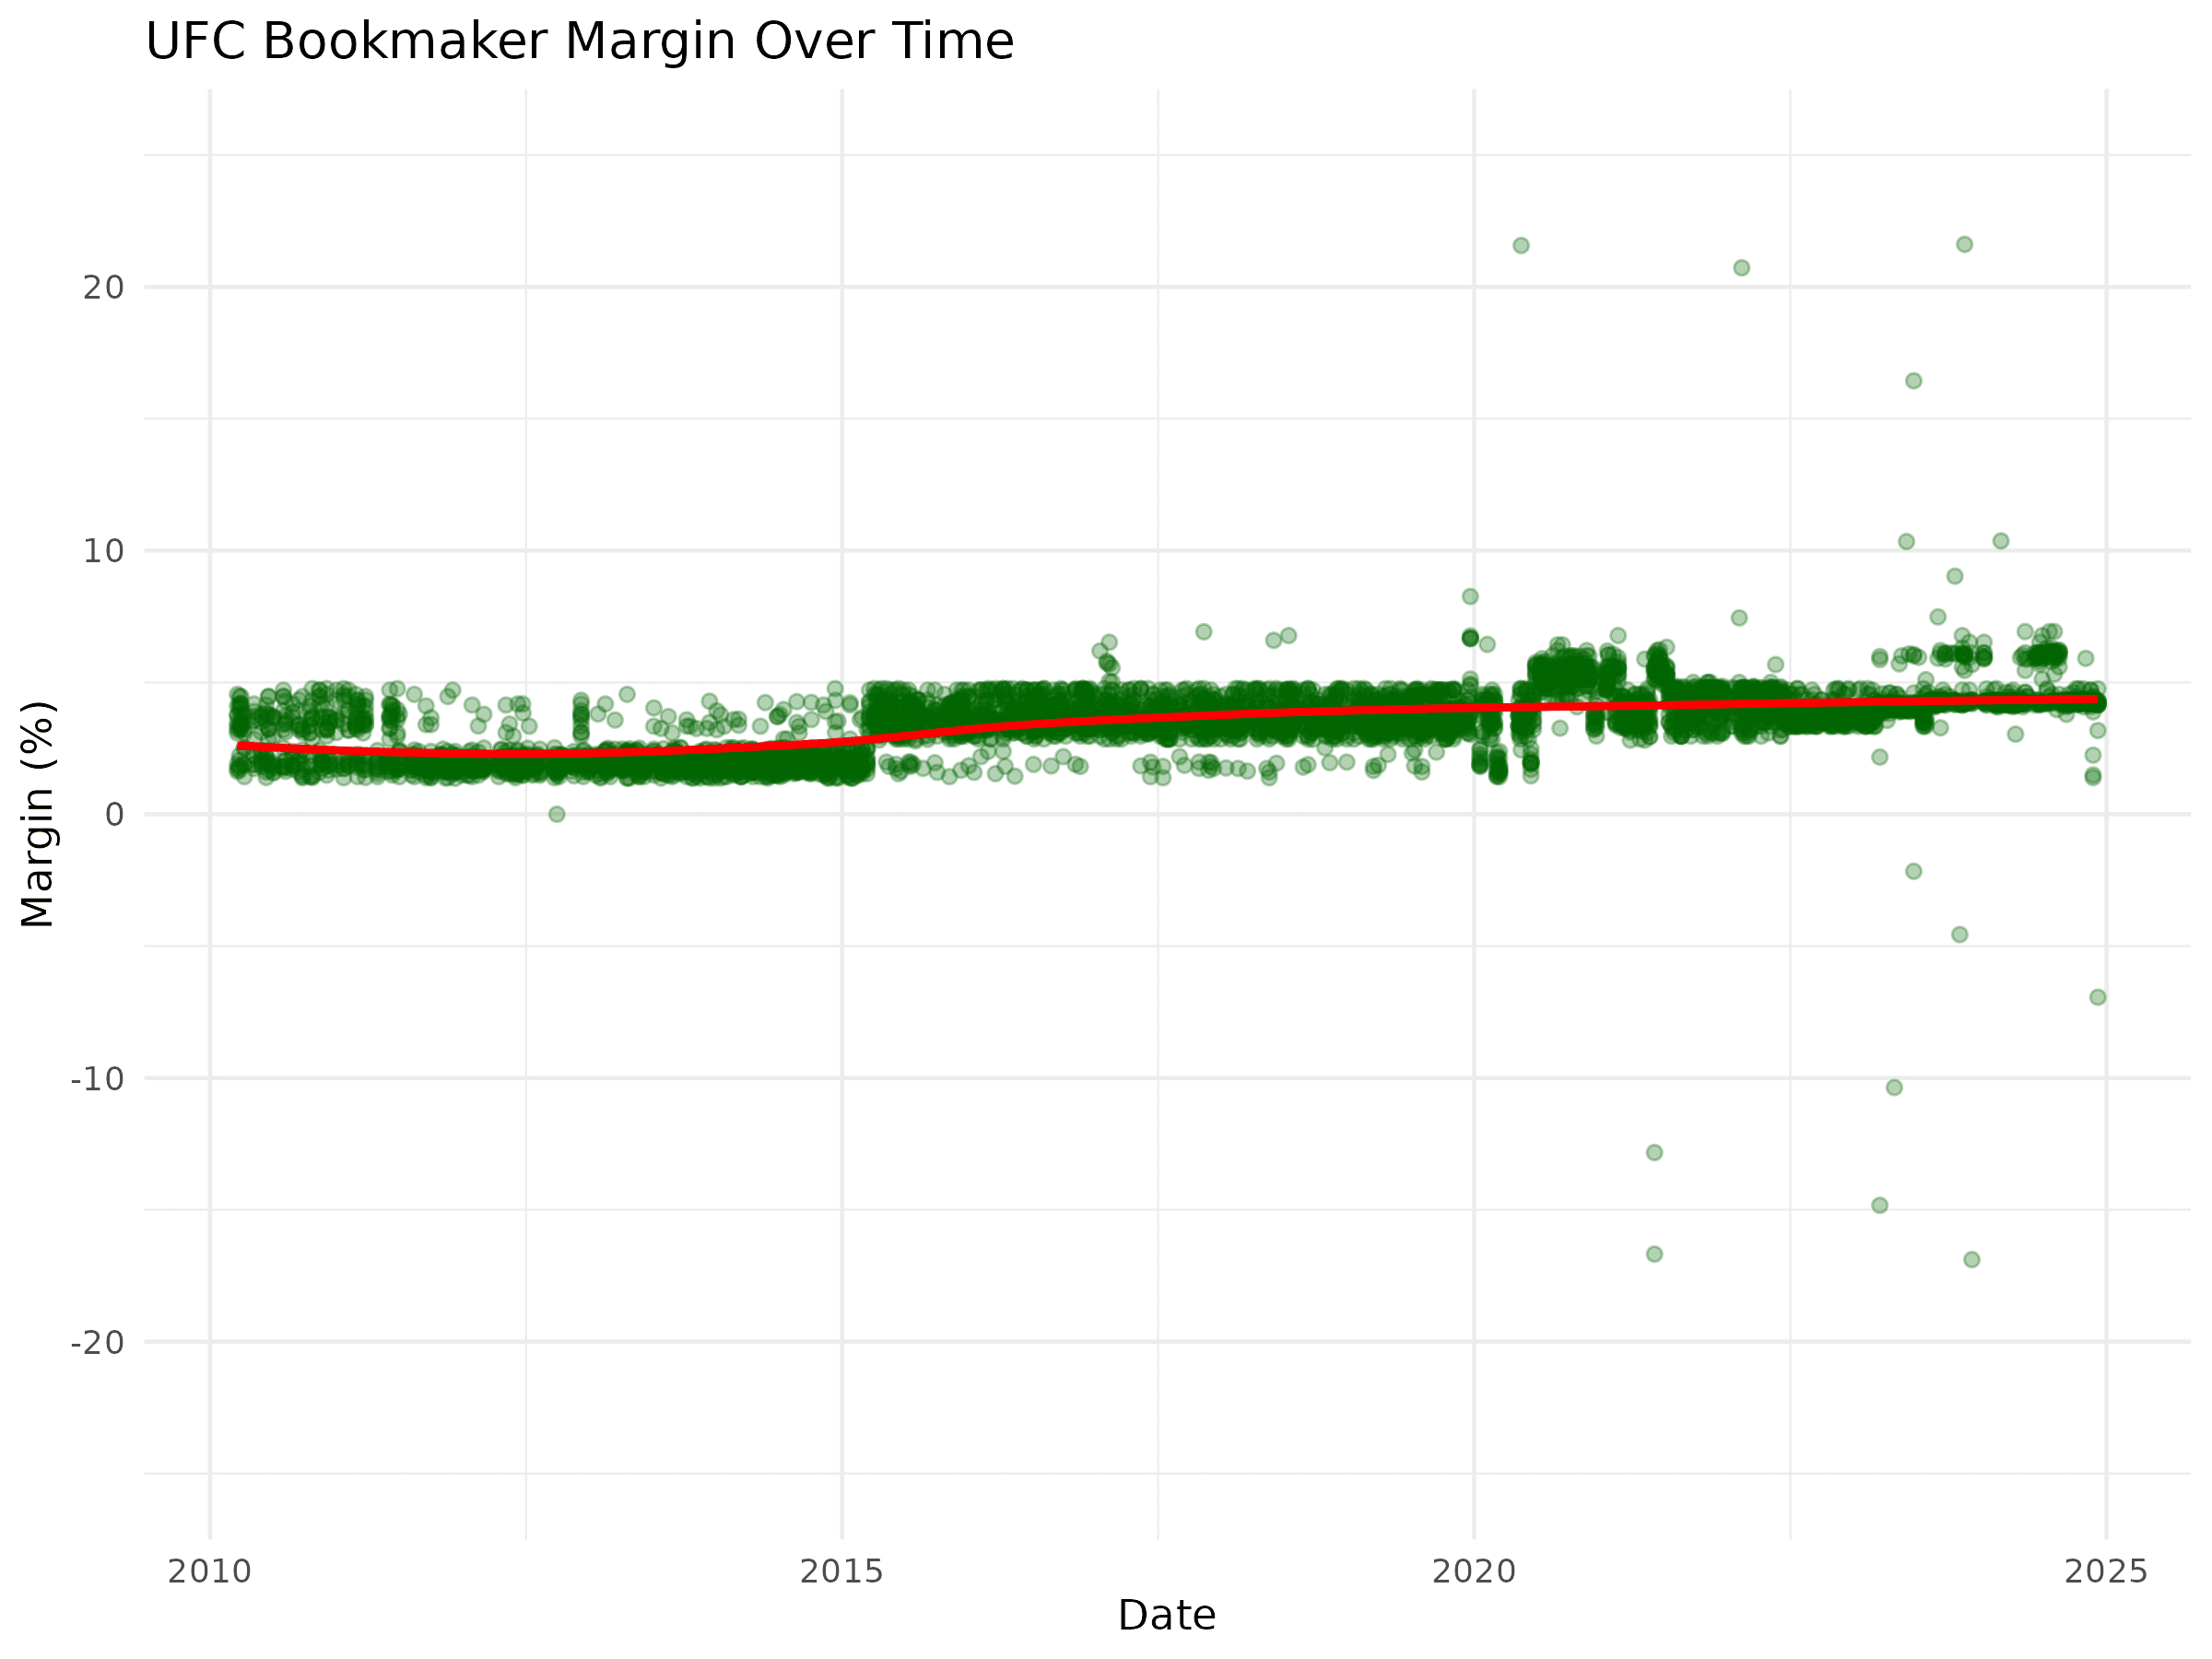
Importantly, the margins are not the same across fights. This is important, because all else being equal, you would want to bet on fights with a low margin, because that means the house takes less of your would-be winnings.
The Accuracy of Odds
In the words of ChatGPT:
"Each blue dot is one bin of fights grouped by implied probability. For example, all favourites with ~60–65% implied win chance go into one bin.
The x-position of the dot = the average implied probability for that bin (e.g. 0.62).
The y-position = the actual win rate of favourites in that bin (e.g. 0.59).
The size of the dot = how many fights were in that bin (bigger dot = more data).
So, visually: if a dot sits on the red dashed line → the odds are perfectly calibrated in that bin (e.g. 60% implied → 60% actual). If a dot is below the line → favourites in that range win less often than the odds suggest (odds overestimate them). If a dot is above the line → favourites in that range win more often than the odds suggest (odds underestimate them)."
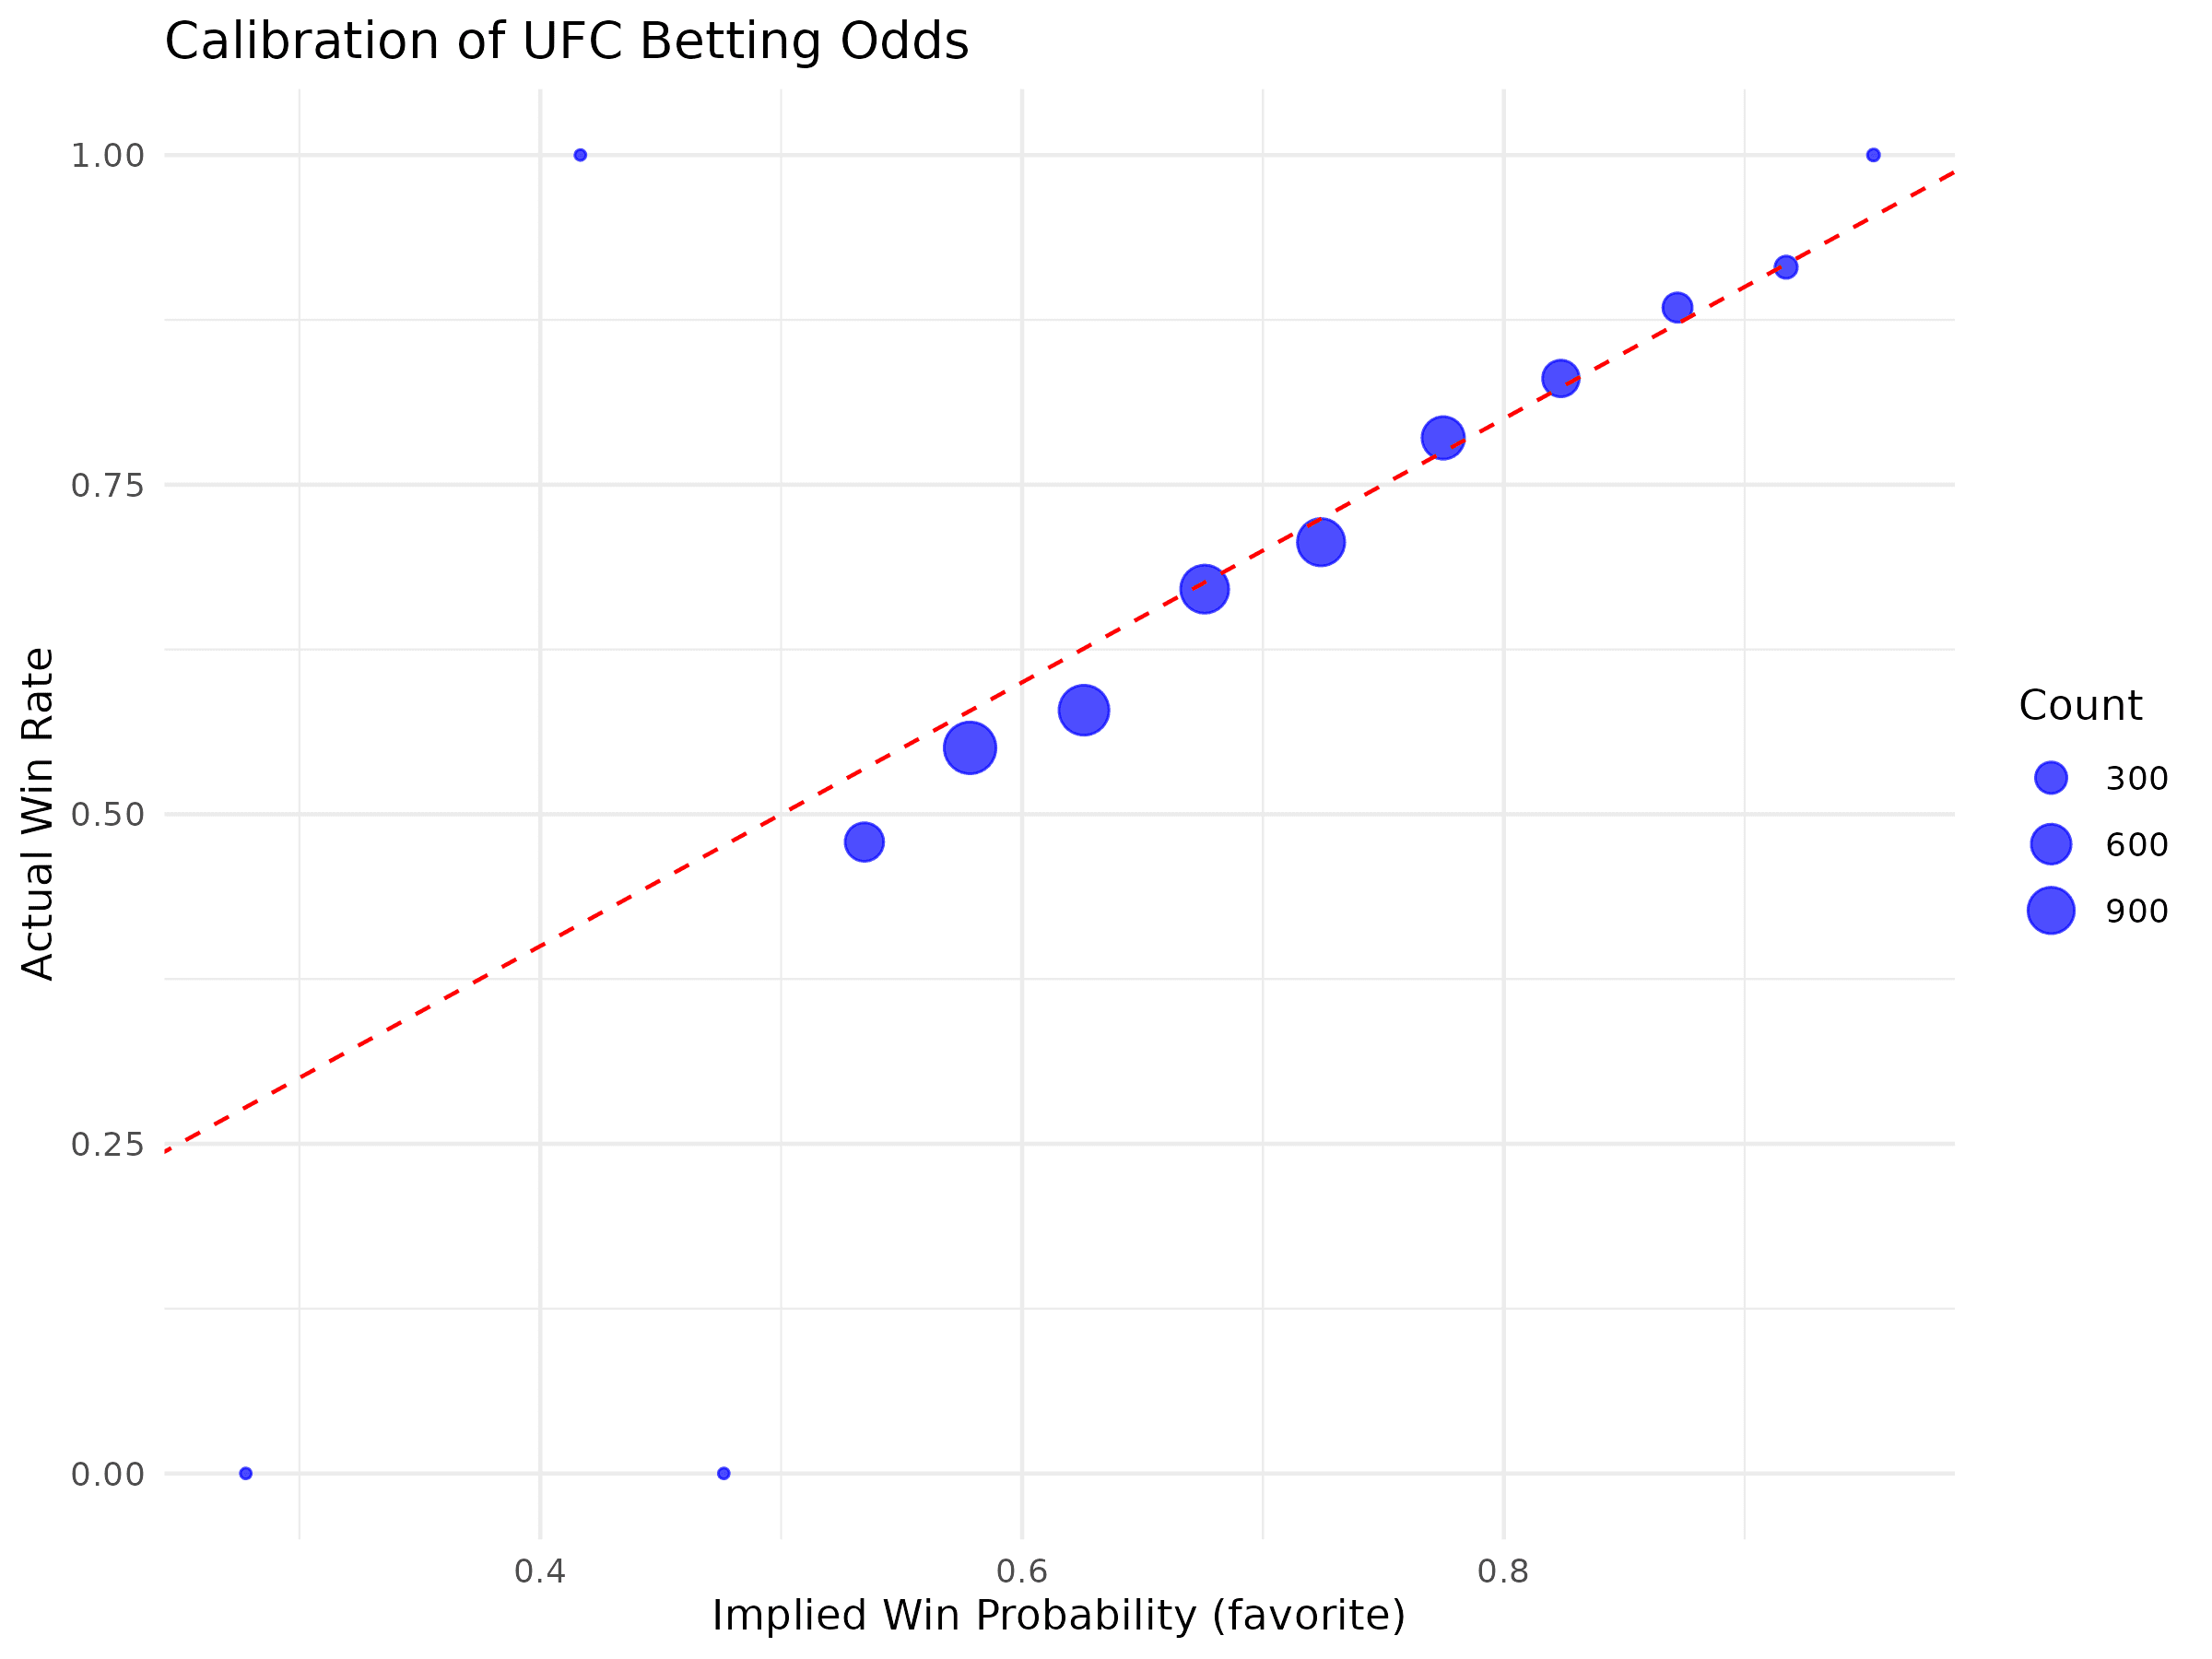
This plot suggests that the general odds are quite accurately priced, as you'd probably expect. To find a potential edge, we can basically make this same plot, but for groups of fights with unique characteristics. Let's start with a fun example: maybe fights in NYC favour the underdog disproportionately.
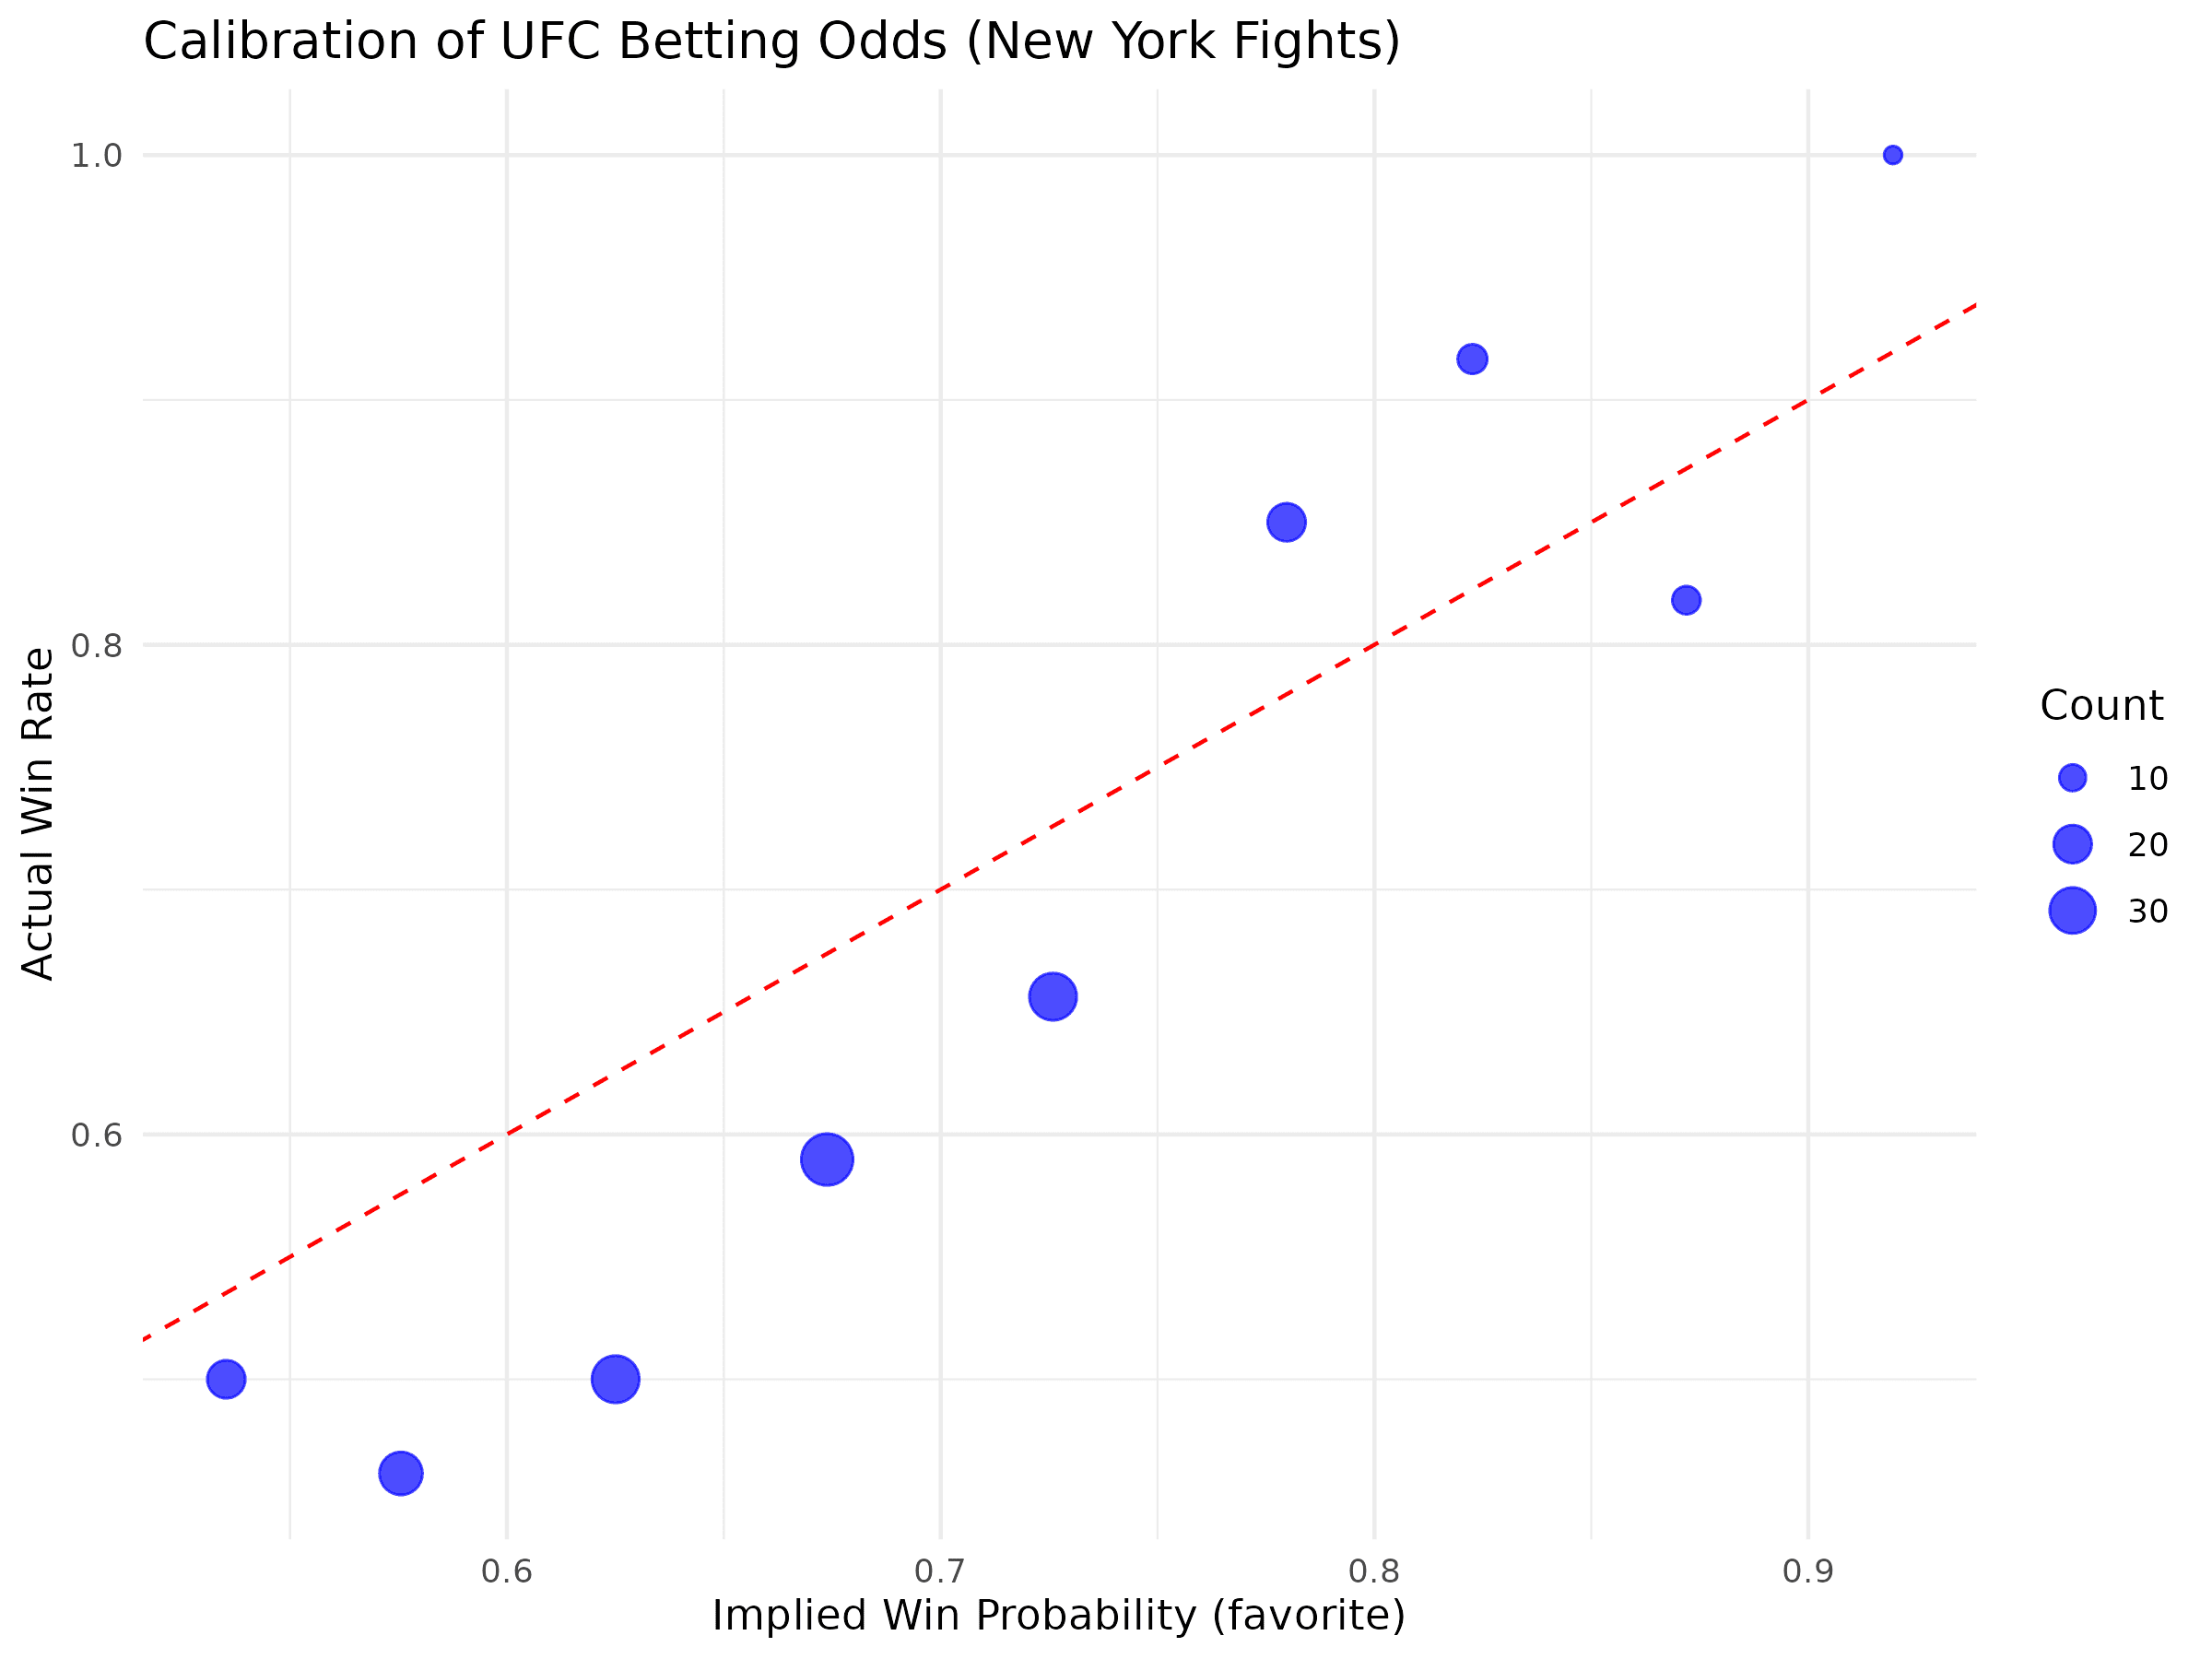
This is the same graph as featured before, but only for fights taking place in NYC. Interestingly, it is possible that fights in NYC may favour the underdog. The favourites have underperformed, as indicated by the blue dots below the red line. However, this may be attributable to more randomness in the relatively few 203 fights that took place in NYC (compared to the over 2000 fights in Vegas, for example). Furthermore, the inaccuracy appears to be only around 0.03%, so even if this tendency is not due to random chance, it is not enough of an edge to get even close to beating the house.
Conclusion
This analysis accomplished what I wanted it to. I was able to produce enough evidence to disprove a hypothesis and write this up in only a couple of hours. The biggest takeaway is not my fairly trivial statistical findings, but rather how I was able to augment my workflow with an LLM to get the result I did quickly, and how this approach can easily scale in complexity and robustness.