Is carbon capture propping up dying industries?
A cost model of the US carbon capture pipeline, and what it says about where the $85 credit actually goes.
1The question
The question this report tests is whether carbon dioxide removal (CDR) credit policy — the Section 45Q tax credit (45Q) — is functioning as a decarbonisation instrument or if it allows struggling carbon-intense firms to continue operations through the sale of carbon credits. If most CDR is sold from firms of this type, that would imply that the effectiveness of CDR policies is limited, as firms pursuing capture may simply shut down without 45Q and hence produce no carbon.
The clear example is the North American pulp and paper industry, which has had a capacity decrease of 6 Mt of pulp & paper in 2025 while similarly US containerboard capacity is down ~10% y/y. Meanwhile the bioenergy with carbon capture and storage (BECCS) proposals are exactly targeted at pulp and paper mills like these. The 45Q policy pays $85/tonne captured for 12 years, which given the high carbon output of these mills would position them for sustained profitable operation.
2Three categories
To better parse this question, I examine producers of CDR credits in three categories, and compare how these projects work under the 45Q policy, and counterfactually without it.
- Greening: Applies to current healthy firms that would continue operations regardless of sourcing carbon credits, but would be operating at a higher carbon intensity.
- Propping: Supports struggling firms that would exit the market without additional revenue through the selling of carbon credits. In a world without carbon credits, these plants cease operations, and overall output in the sector either decreases or is served elsewhere.
- Enabling: Applies to carbon capture facilities attached to new hosts built to serve exogenous demand. Counterfactually, in a world without 45Q, the host plants are still built and generate large amounts of uncaptured carbon. The exemplar of this category are data-centers, which are driven by demand that grows regardless of their carbon intensity.
We often think of the first two when discussing CDR, while Enabling actually is the largest category, at 39% of the US pipeline, mostly in the form of gas turbines powering data-centers. There has been 101 GW of behind-the-meter gas announced for US data centres, 57 GW with equipment orders placed, and ~7 GW currently under construction, while EPA's June 2025 Section 111 repeal removed capture as a requirement for new turbines, so this buildout is driven by AI load, not carbon policy.
3The model
Using an economic model we can simply illustrate the mechanism behind the carbon credits, and see under what conditions firms pursue capture, or exit the market absent of capture. Importantly we can see the substitution effect of a plant closing, so instead of comparing a captured plant to its uncaptured counterfactual, we can compare the captured plant's carbon impact to the counterfactual impact made by other plants increasing production to replace the decreased output of the initial plant.
k — how dirty the replacement supply is, relative to the plant being modelled. More precisely the % of emissions replacement supply is of new emissions.
η — capture rate, the % of carbon produced that is captured, set at a design benchmark of 0.90.
ρ — share of lost output actually replaced. Held at the upper bound of 1.0, meaning a perfectly elastic market where demand is fully replaced (assumption most generous to the capture project).
λ — the fraction of each captured tonne that's genuine abatement, the fraction of carbon captured that contributes to net zero.
| k | λ | Public cost per real tonne |
|---|---|---|
| 1.10 | 1.11 | $77 |
| 1.00 | 1.00 | $85 |
| 0.85 (pulp) | 0.83 | $102 |
| 0.42 (coal) | 0.36 | $239 |
| 0.10 | 0.00 | no abatement |
| 0.00 | −0.11 | emissions increase |
x
λ comes straight from the formula above, holding η = 0.90 and ρ = 1.00:
Public cost per real tonne = the $85 credit divided by λ. If only 36% of a captured tonne is genuine abatement, the public pays $85 ÷ 0.36 = $239 for each real tonne.
The k values in brackets are sector estimates grounded in the literature — see the calibration table below for sources. The other rows are illustrative, showing the shape of the function.
Where the sign flips: λ reaches zero when ρk = 1 − η = 0.10. Below that, capture is worse than closure — it leaves the uncaptured 10% residual where closure would have removed everything. At ρ = 0 the multiplier is −0.111 regardless of k.
model output Every figure in this table is computed, not observed.
By inputting different values into the model we find the case necessary (ρk = 1 − η) for capture to be worse than letting the plant close. The degenerate CDR use case. This is the case where CDR pays to keep a dirty plant running instead of letting cleaner supply take over. No malintent needs to be present, the CDR is simply distorting the market sufficiently to bring about this outcome.
4Calibration
Calibrating our model to real data by setting the model parameters to the types of firms, and examining model outputs for each type of firm, we arrive at the range of prices firms are willing to accept to sell carbon and the abatement created.
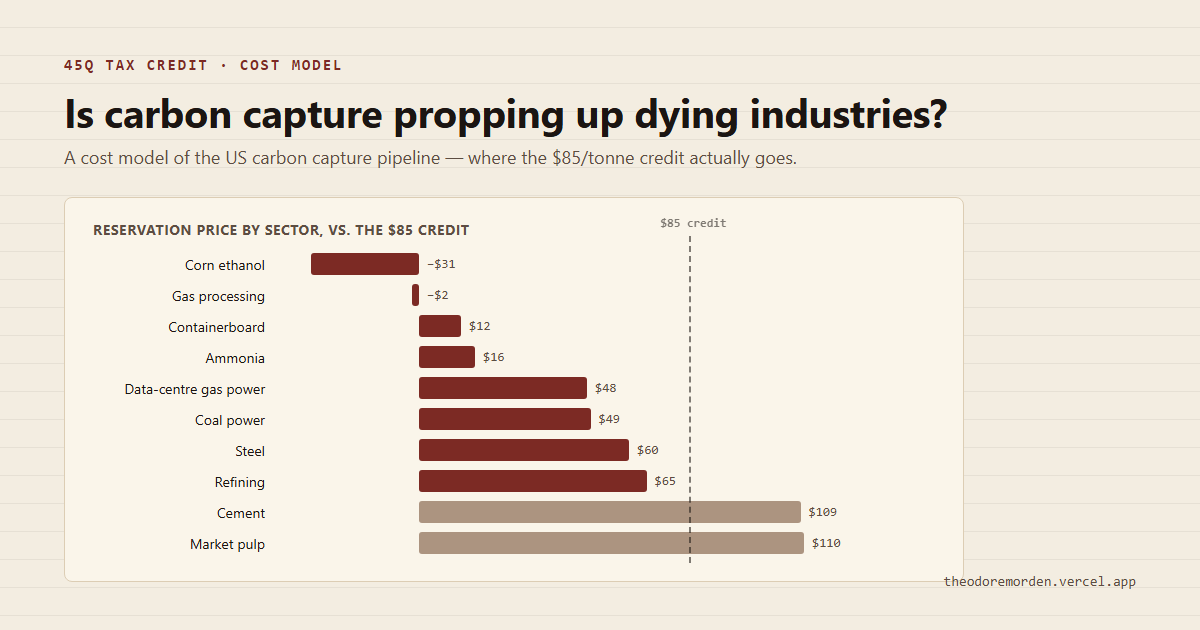
Reservation price = levelised capture cost minus revenue earned from sources other than 45Q. It is the minimum credit a firm needs before it will supply a captured tonne.
| Sector | k | λ | Capture cost $/t | Non-45Q revenue $/t | Reservation price | Clears $85? | $/real tonne | Mtpa |
|---|---|---|---|---|---|---|---|---|
| Steel (DRI/EAF) | 1.57 | 1.63 | 75 | 15 | $60 | ✅ | $52 | 0.8 |
| Ammonia / blue H₂ | 1.15 | 1.17 | 36 | 20 | $16 | ✅ | $73 | 25.3 |
| Gas processing | 1.00 | 1.00 | 23 | 25 | −$2 | ✅ | $85 | 13.4 |
| Data-centre gas power | 1.00 | 1.00 | 88 | 40 | $48 | ✅ | $85 | 14.6 |
| Refining | 1.00 | 1.00 | 70 | 5 | $65 | ✅ | $85 | 2.0 |
| Direct air capture (DAC) | 1.00 | 1.00 | 525 | 225 | $300 | ❌ | $180 | 1.0 |
| Corn ethanol | 0.95 | 0.94 | 29 | 60 | −$31 | ✅ | $90 | 11.8 |
| Cement | 0.88 | 0.87 | 117 | 8 | $109 | ❌ | $98 | 4.5 |
| Containerboard | 0.88 | 0.87 | 112 | 100 | $12 | ✅ | $98 | 1.9 |
| Market pulp | 0.85 | 0.83 | 120 | 10 | $110 | ❌ | $102 | 1.5 |
| Coal power | 0.42 | 0.36 | 68 | 18 | $49 | ✅ | $239 | 8.4 |
x
Column by column, and what kind of number each one is.
| Column | Type | How it is produced |
|---|---|---|
| k | sourced | Emissions intensity of replacement supply relative to the host. Pulp from recycled-vs-virgin LCA (408 vs 508 kgCO₂e/t) plus DOE bandwidth and BioResources on mill efficiency; cement from EPA intensity data; steel from IEEFA and SteelWatch (BF-BOF 2.2 vs DRI-EAF 1.4 tCO₂/t); coal from generation emission factors and NBER on retirement displacement. Gas processing and data-centre power — the two largest Enabling-category rows — are set to k = 1 by construction because there is no substitution or closure counterfactual to model: the host facility is built regardless of 45Q, so λ = 1 for these rows is a modelling assumption, not a measured output. Refining is set to k = 1 on the same structural basis. |
| λ | computed | (k − 0.1) / 0.9, from the formula above. |
| Capture cost | sourced est. | Levelised cost of CO₂ captured — annualised capital plus operating cost. Taken from techno-economic literature per capture configuration; $91/t for kraft limekiln is representative for pulp. High-purity streams (ethanol, ammonia, gas processing) are cheap because the CO₂ is already concentrated and needs only compression and dehydration; dilute flue gas requires a full amine plant. |
| Non-45Q revenue | estimate | Revenue the project earns from sources other than the tax credit: CO₂ sales for enhanced oil recovery (EOR), 45Z and California's Low Carbon Fuel Standard (LCFS) carbon-intensity credits (ethanol), contracted voluntary carbon-removal offtake (containerboard, reflecting the Microsoft–CO280 purchase), and low-carbon product premia. This is the weakest column — it is calibrated to observable market prices but not measured per project. |
| Reservation price | computed | Capture cost minus non-45Q revenue. The minimum credit a firm needs before supplying a captured tonne. Negative values mean the project is economic with no credit at all. |
| Clears $85? | computed | Reservation price ≤ $85 ($180 for DAC). |
| $/real tonne | computed | Credit divided by λ. What the public pays per tonne of genuine atmospheric benefit. |
| Mtpa | sourced | Announced capture capacity from company disclosures, SEC filings, DOE programme documents, the IEA CCUS database and the Global CCS Institute 2025 status report. These are nameplate figures; several operating plants run materially below design. |
Read the two halves separately. The left columns (k, λ, $/real tonne) answer is this worth buying? The middle columns (capture cost, non-45Q revenue, reservation price) answer will anyone sell it at $85? They are driven by unrelated physical facts — the first by what replaces a closed plant, the second by how concentrated its CO₂ stream is.
The left side of the table (k, λ, $/real tonne) shows inputs relevant to public decision making on CDR, giving an approximate answer to the question is this worth buying? These values approximate genuine atmospheric benefit per dollar. The middle (non-45Q revenue and reservation price) informs firms' decisions — will anyone sell carbon at $85? The reservation price is the minimum credit they need for building capture infrastructure to be worthwhile.
Two sectors, ethanol at −$31 and gas processing at −$2, have negative reservation prices. Their non-45Q revenue already exceeds capture cost, so they would capture with no credit at all. That is 25 Mtpa, and this also matches the share of the pipeline that stays financeable under a full repeal.
What we find in the table is the following:
1. 45Q cannot be propping up pulp mills or cement plants. Reservation prices of $110 and $109 against an $85 credit. They can't access the money. Whatever is happening to those mills, 45Q isn't the cause, as carbon capture infrastructure is cost-prohibitive for these industries. This is the single cleanest finding in the whole analysis and it comes purely from cost data.
2. Two big sectors would capture without 45Q at all. Ethanol at −$31 and gas processing at −$2 reservation. Their non-45Q revenue (LCFS credits, EOR sales) already exceeds capture cost. That's 25 Mtpa, or a third of the pipeline, where 45Q isn't the marginal driver of anything. That's greening by revealed preference, not by classification.
3. Coal is the one sector where propping-shaped harm is actually possible. It clears easily ($49, or $39 at co-op financing), its hosts are genuinely marginal (coal is retiring everywhere), and λ is 0.36. All three conditions met. 8.4 Mtpa — about 10% of the pipeline.
Evidence of greening is strong and comes straight from the cost data. Most of the pipeline is either high-purity streams at healthy firms, or projects that would happen anyway. Evidence of propping is narrow, and concentrated almost entirely in coal. The sectors that look most like zombie candidates are excluded by economics before policy design even factors in.
Further caveat: real-world prices suppliers are willing to accept will differ due to administrative expenses and risk in building new technological facilities. Two more push the same direction: 45Q runs for 12 years against an asset financed over roughly 20, and the figures above are levelised — once built, a plant runs on cash cost.
5Financing
Further adding to the model, we add financing considerations — the weighted average cost of capital (WACC) by industry. Certain cash-liquid sectors can finance a carbon capture project considerably more cheaply than others, allowing them to enter at a lower cost of captured carbon. To account for this we separate the cost of building a plant into full levelised cost of capture (LCOC) and cash operating cost, as building requires clearing full LCOC, which includes capital recovery via the capital recovery factor (CRF). Conversely running one already built only requires clearing cash operating cost, at 35–55% of levelized. Capital is sunk, so it can't be recovered by shutting down.
| Sector | WACC | LCOC at 9% | LCOC at own WACC | Reservation | Clears $85? |
|---|---|---|---|---|---|
| Coal power (co-op, USDA financing) | 5.0% | $68 | $58 | $39 | ✅ |
| Data-centre gas power | 6.5% | $88 | $80 | $40 | ✅ |
| Ammonia / blue H₂ | 8.0% | $36 | $35 | $15 | ✅ |
| Gas processing | 8.5% | $23 | $22 | −$3 | ✅ |
| Steel | 8.5% | $75 | $74 | $59 | ✅ |
| Cement | 9.0% | $117 | $117 | $109 | ❌ |
| Containerboard | 9.5% | $112 | $115 | $15 | ✅ |
| Market pulp | 10.5% | $120 | $128 | $118 | ❌ |
| Corn ethanol | 11.5% | $29 | $31 | −$29 | ✅ |
| Direct air capture | 17.0% | $525 | $737 | $512 | ❌ |
x
LCOC is rebuilt for each sector at its own cost of capital using the formula above. Capital intensity K and cash operating cost o are held fixed — they are properties of the plant, not of who owns it — so only the capital recovery factor changes.
The WACC figures are estimates estimate, built from industry-average cost of capital adjusted for financing structure. Two are worth naming: coal retrofit at 5% reflects rural electric cooperative financing through USDA facilities, which is how Project Tundra is capitalised; DAC at 17% reflects venture-stage equity. These are not sourced to a specific dataset and should be read as indicative.
What the table shows is a null result. No sector changes its participation decision. Everything that cleared at a uniform 9% still clears at its own cost of capital; everything that failed still fails. Reservation prices are simply not close to the $85 threshold — cement sits at $109, coal at $49.
The exception is DAC, where capital dominates the cost stack and LCOC moves $525 → $737. For capital-heavy configurations financing terms matter enormously; for everything else the CO₂ stream chemistry dominates.
The result is a null that is non the less informative: varying the cost of capital changes no participation decision at all. Every sector that cleared $85 at a uniform 9% still clears at its own cost of capital, and every sector that failed still fails. Reservation prices simply aren't close enough to the threshold for financing terms to move them.
What this tells us is that capture economics are set by flue-gas chemistry, over balance sheets. A coal cooperative borrowing at 5% and an ethanol producer borrowing at 11.5% both clear, while a cement plant at 9% and a pulp mill at 10.5% both fail. Stream purity is the dominant effect. The exception is DAC, where capital is the major cost and LCOC moves from $525 to $737, which is a large factor of why DAC struggles regardless of credit level.
6The repeal asymmetry
A final question: what happens if 45Q is withdrawn? Because building and running are governed by different cost thresholds, the answer splits in two.
| Capacity | Share | |
|---|---|---|
| Still financeable — revenue ≥ levelised cost | 25.5 Mtpa | 30% |
| Still running if already built — revenue ≥ cash cost | 58.4 Mtpa | 69% |
x
Both rows set the 45Q credit to zero and test each project in the database on its remaining revenue.
Financeable asks whether non-45Q revenue covers full levelised cost, including capital recovery. That is the test a board applies before committing capital.
Still running asks whether non-45Q revenue covers cash operating cost only — energy, solvent, maintenance, transport and storage fees. Once a plant is built its capital is sunk and cannot be recovered by shutting down, so this is the relevant threshold for continuing to operate.
Cash cost runs 35–55% of levelised cost depending on configuration estimate. High-purity streams are capital-light; dilute flue gas and DAC are capital-dominated.
The two sectors driving the 30% figure are gas processing and ethanol, whose non-45Q revenue already exceeds capture cost — the same two sectors with negative reservation prices in the calibration table.
model output Computed across 38 project line items totalling 85.2 Mtpa.
The 32.8 Mtpa wedge sits between the conditions allowing firms to continue operations with carbon capture and the conditions allowing new carbon capture to be financed. A repeal freezes new build without shutting the operating fleet. For the propping argument specifically, it means policy risk operates as an entry deterrent, not an exit trigger — withdrawing 45Q wouldn't kill the zombies, it would stop the next tranche being built.
7What this means for capture businesses
The same table that answers the policy question also functions as a market map. Reservation price tells a developer where demand exists at $85; λ tells them which of that demand is politically durable. The two do not point in the same direction, which is where the strategic content sits.
For technology producers and deployers:
- The unserved market is precisely the technically hardest one. Cement ($109) and market pulp ($110) sit ~$25 above the credit, resulting in 6 Mtpa being economically unviable. If dilute-flue-gas capture cost is able to be cut by 20–25%, then the whole segment opens. This is the clearest technical target the model identifies.
- High-purity streams have already been captured. Gas processing ($23/t) and ethanol ($29/t) are already economical and served. The value of a better solvent is inversely proportional to stream purity. Avoid competition in this space.
- Target opex, not capex, except in DAC. The financing test showed cost of capital changes no participation decision anywhere except direct air capture, where LCOC moves $525 → $737 at venture-rate financing. So for point-source, target the energy cost. For DAC, capital cost is the product.
For deployers:
- Reservation price is a market map, with headroom representing margins for capture deployment firms. Ammonia has $69/t of headroom across 25.3 Mtpa. Data-centre power $37 across 14.6 Mtpa. Steel $25. Those three are the addressable market at $85.
- Originating non-45Q revenue beats optimising capture cost. Every sector that comfortably clears has a second revenue stream. Containerboard's reservation is $12 only because of ~$100/t contracted CDR offtake; removing that and it performs nearly identically to market pulp and doesn't clear at all. A CDR contract or LCFS pathway is worth more than an equivalent capex reduction, and unlike the credit is robust to a 45Q repeal.
- Build fast. The pipeline is fragile, assets aren't. 30% of announced capacity is financeable without the credit; 69% keeps running if already built. Making a compelling case for accelerating to FID over optimising pre-FID. It also means a repeal would create a buyer's market in built assets whose sponsors underwrote to the wrong test.
- Position for tiering. Concentration in coal retrofit exposes you to a reform that is cheaper for taxpayers, better for emissions, and politically attractive. Under a credit tiered at 85 × λ, coal loses $55/t and drops out of the market entirely, while steel gains $54/t and ammonia $14/t. Steel and ammonia are the natural hedge that would gain under the same reform.
- Coal retrofit carries reputational exposure beyond its economics. It's 10% of the pipeline, but could be the case study that discredits the sector.
It is also worth flagging that:
8Conclusion
The propping hypothesis largely fails. But not because of the subsidy design. The major factor is that the mills where propping would be a concern can't afford to participate. Market pulp needs $110 against an $85 credit.
What the market selects for is capture cost, which is set by how concentrated a plant's CO₂ stream is. Which has nothing to do with abatement quality. Coal is the clear example, with the worst λ in the portfolio (0.36), and a reservation price that comfortably clears the credit ($49), but can afford to install carbon capture and qualifies.
The current limitation of the policy is some carbon sources qualify without capture of these firms having a large impact in net zero. A natural response is to tier CDR credits based on the carbon intensity that could replace a plant (ie. λ is 1.63 for steel, where capture prevents dirtier imports, versus 0.36 for coal, where the grid would have replaced it with something cleaner anyway).
Despite this challenge the policy generally is working. Enabling is the largest use of the subsidy at 39%, and the decarbonisation subsidy is making gas turbines for AI data centres cleaner. By the model's own logic that's legitimate: λ = 1.
The only thing worth noting is that this is a different political proposition than what 45Q was sold as. The subsidy isn't propping up zombies. It's just not aimed at anything exact.
Methodology. Model specification, project database, parameter register, source list and limitations: full methodology note.
On the numbers. Figures marked sourced carry a link. Those marked model output are computed from the model and are only as good as its inputs. Those marked estimate are the author's judgement — the parameter register lists every one with the direction of bias it introduces.
Not advice. Independent analysis published for discussion. Not investment, legal or policy advice. No commercial relationship with any project or company named.